How To Paint A Colour Value Chart
In the previous post I talked about colour theory and colour wheels, in this post I’m expanding on something I touched on in the previous post - hue and value.
HUE AND VALUE
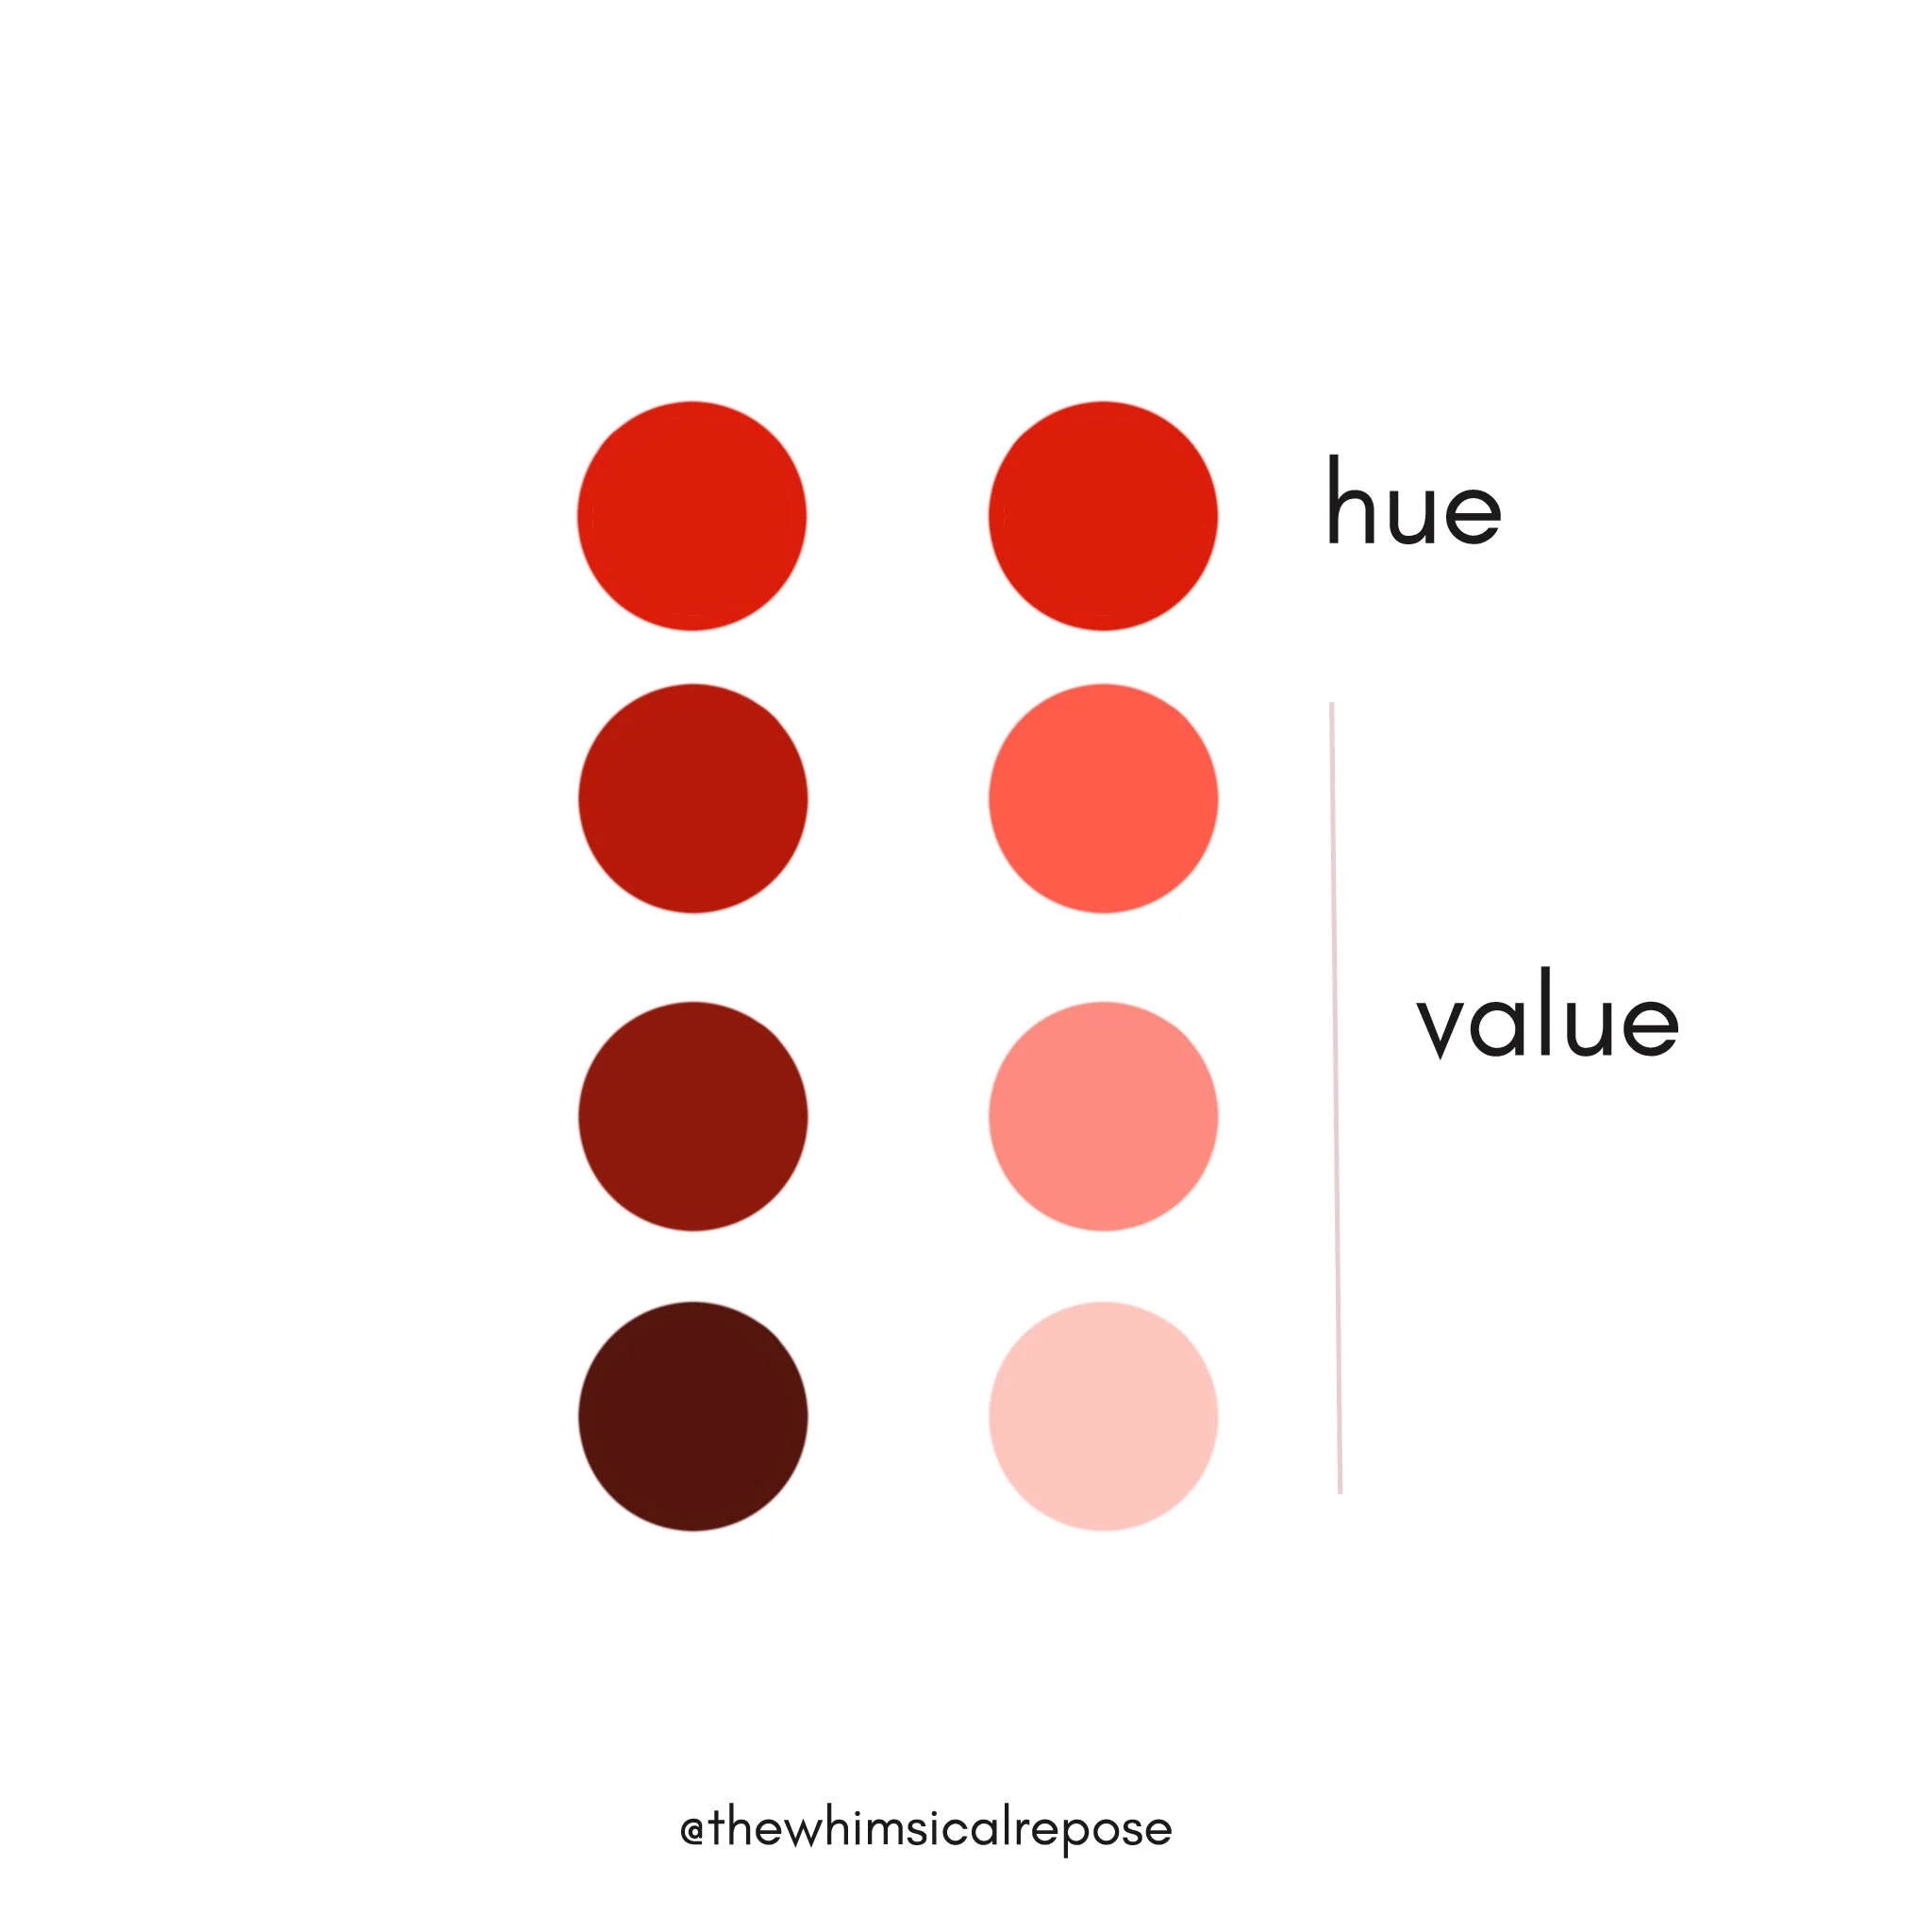
You can make a colour (hue) lighter or darker by adding white (tint) or adding black (tone) or even grey (shade), but the most basic way of lightening a watercolour is by using water.
HUE VALUE SCALE CHART
A hue value scale chart is basically a way to record the intensity of all your paint colours on a chart so that you can see how the colour looks like when it’s at it’s strongest intensity and what it looks like when it’s watered down. This helps you develop a better understanding of your colours and will give you clarity on colour usage and how much water to use if you want to achieve a certain value.
CREATING A HUE VALUE SCALE CHART
There are a few ways one can paint a hue value scale chart, depending on your preferences.
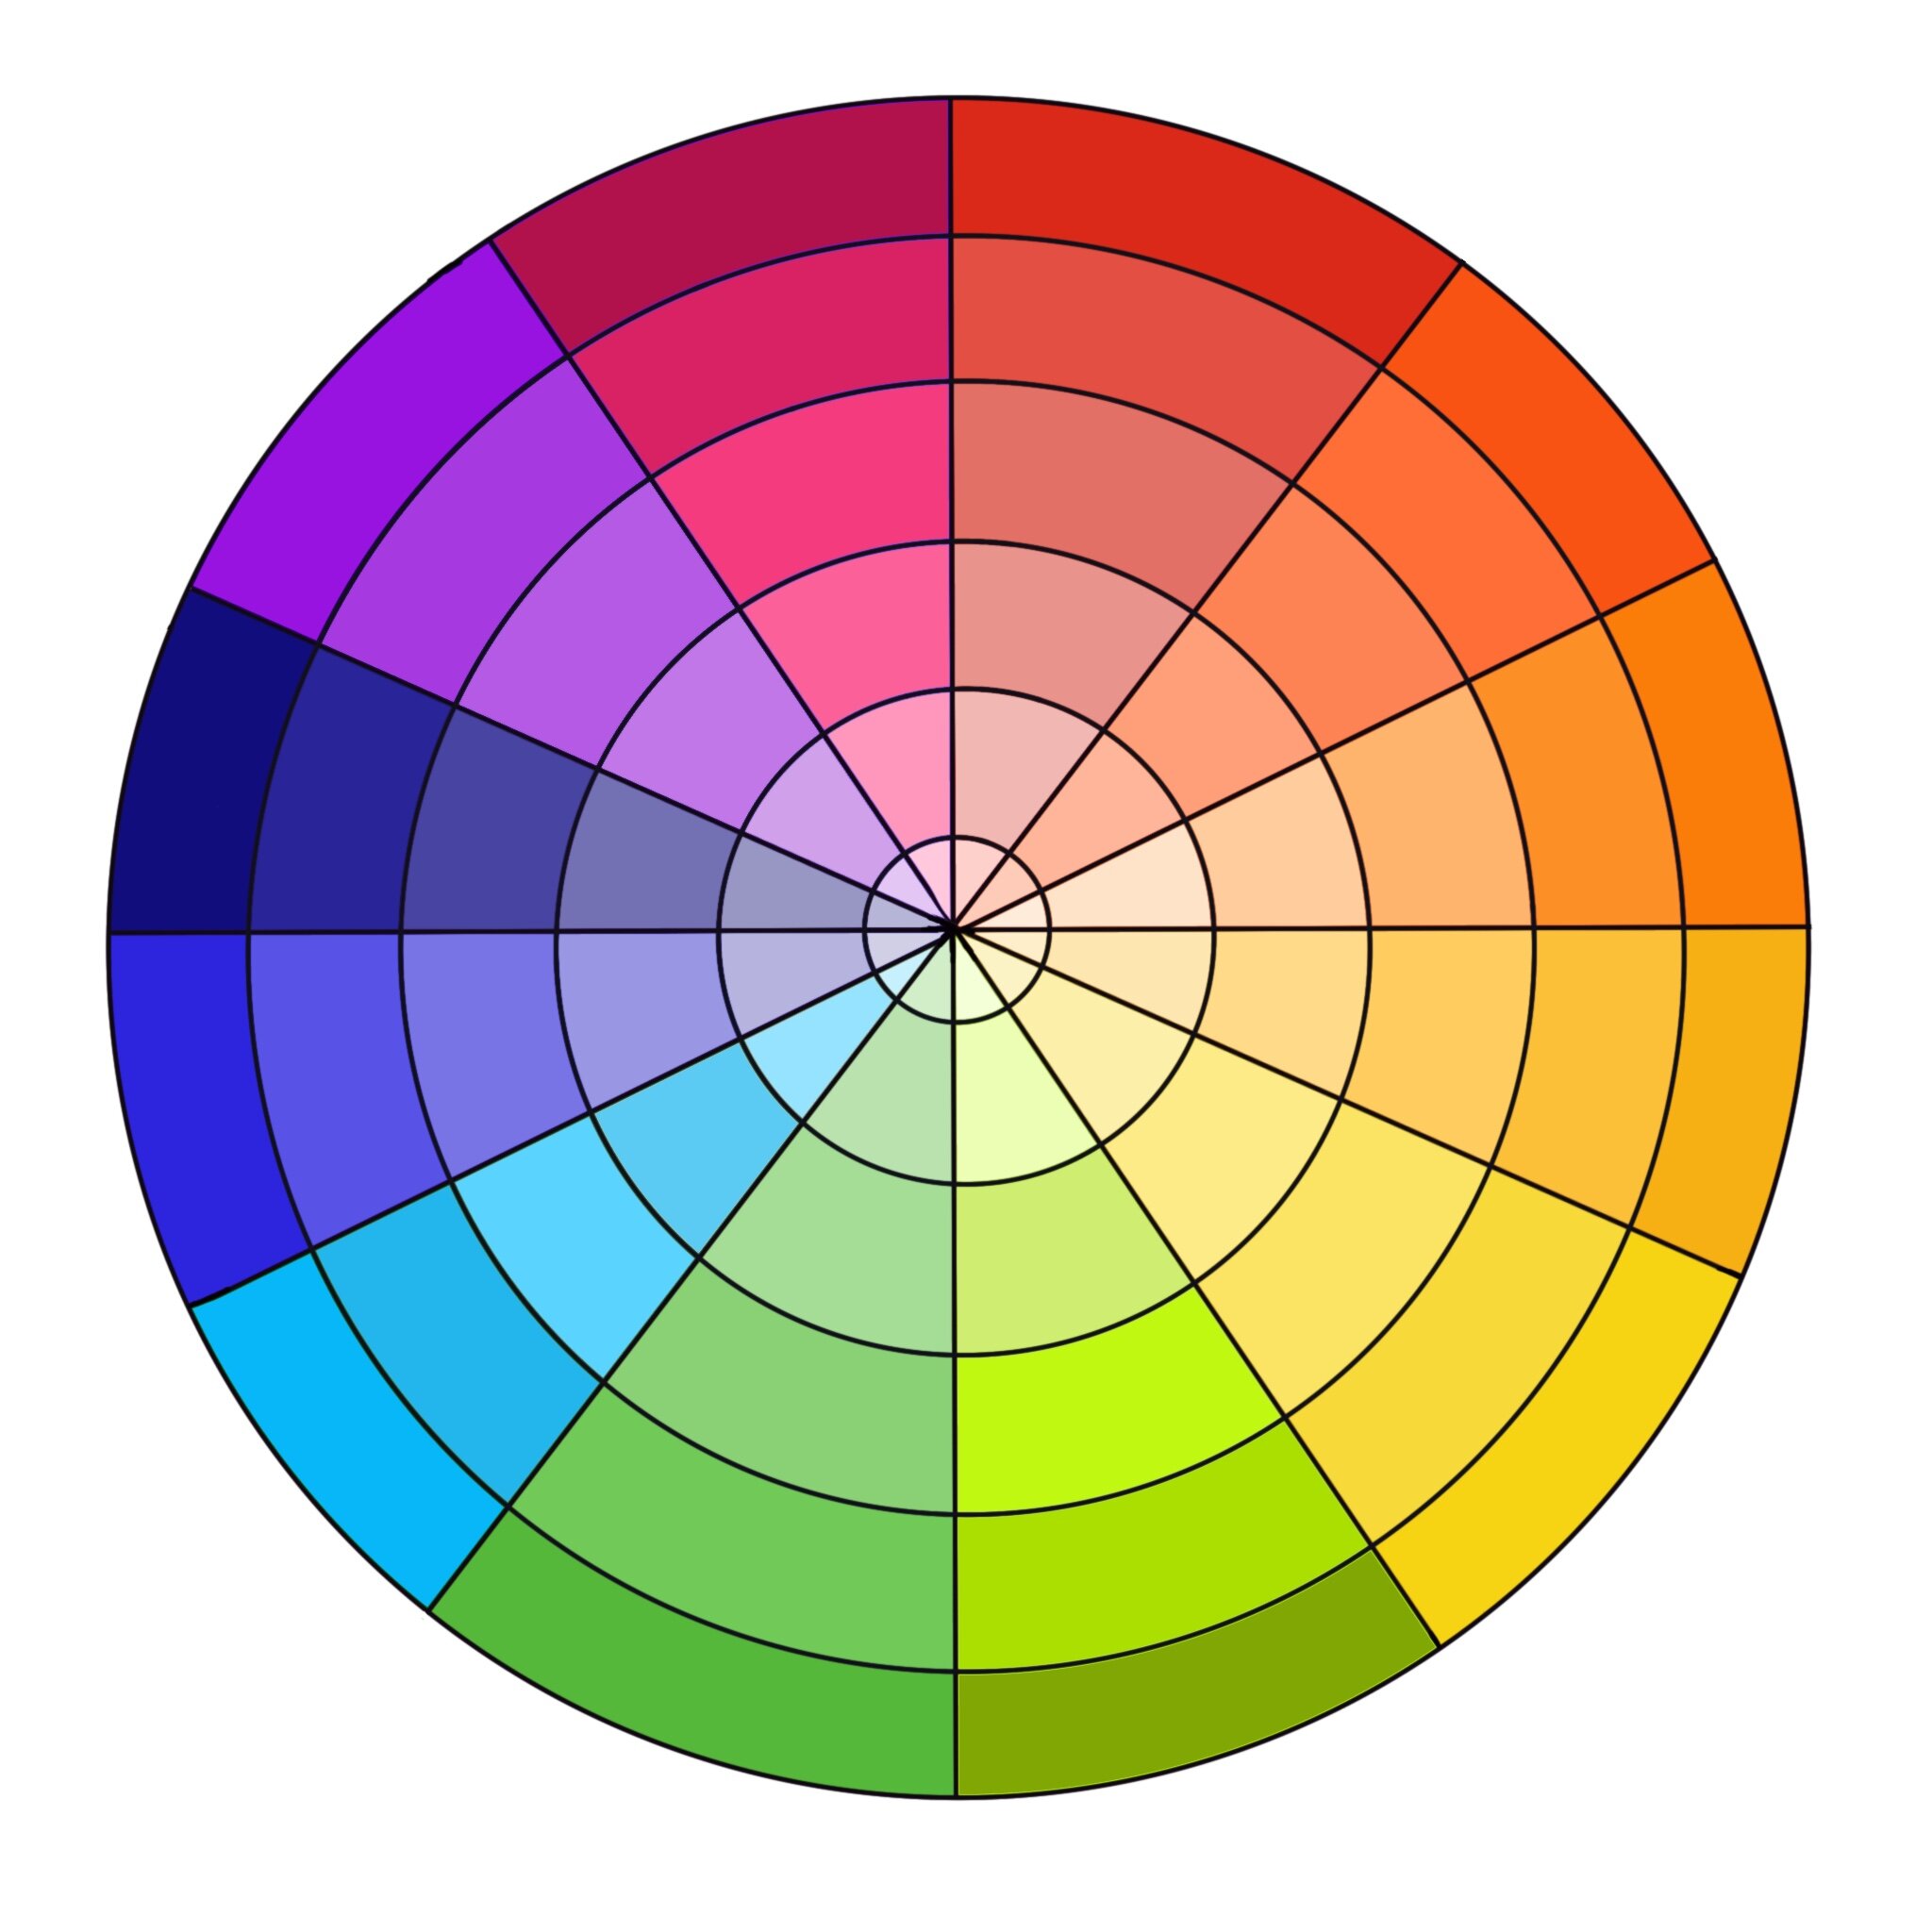
You can do it within a colour wheel, so that when you use the colour wheel for reference, you can also see clearly the value difference so that it helps your colour pairing decision easily.
Another way to do it is to swatch all the colours on your palette so that you can see all the colours and their corresponding values.
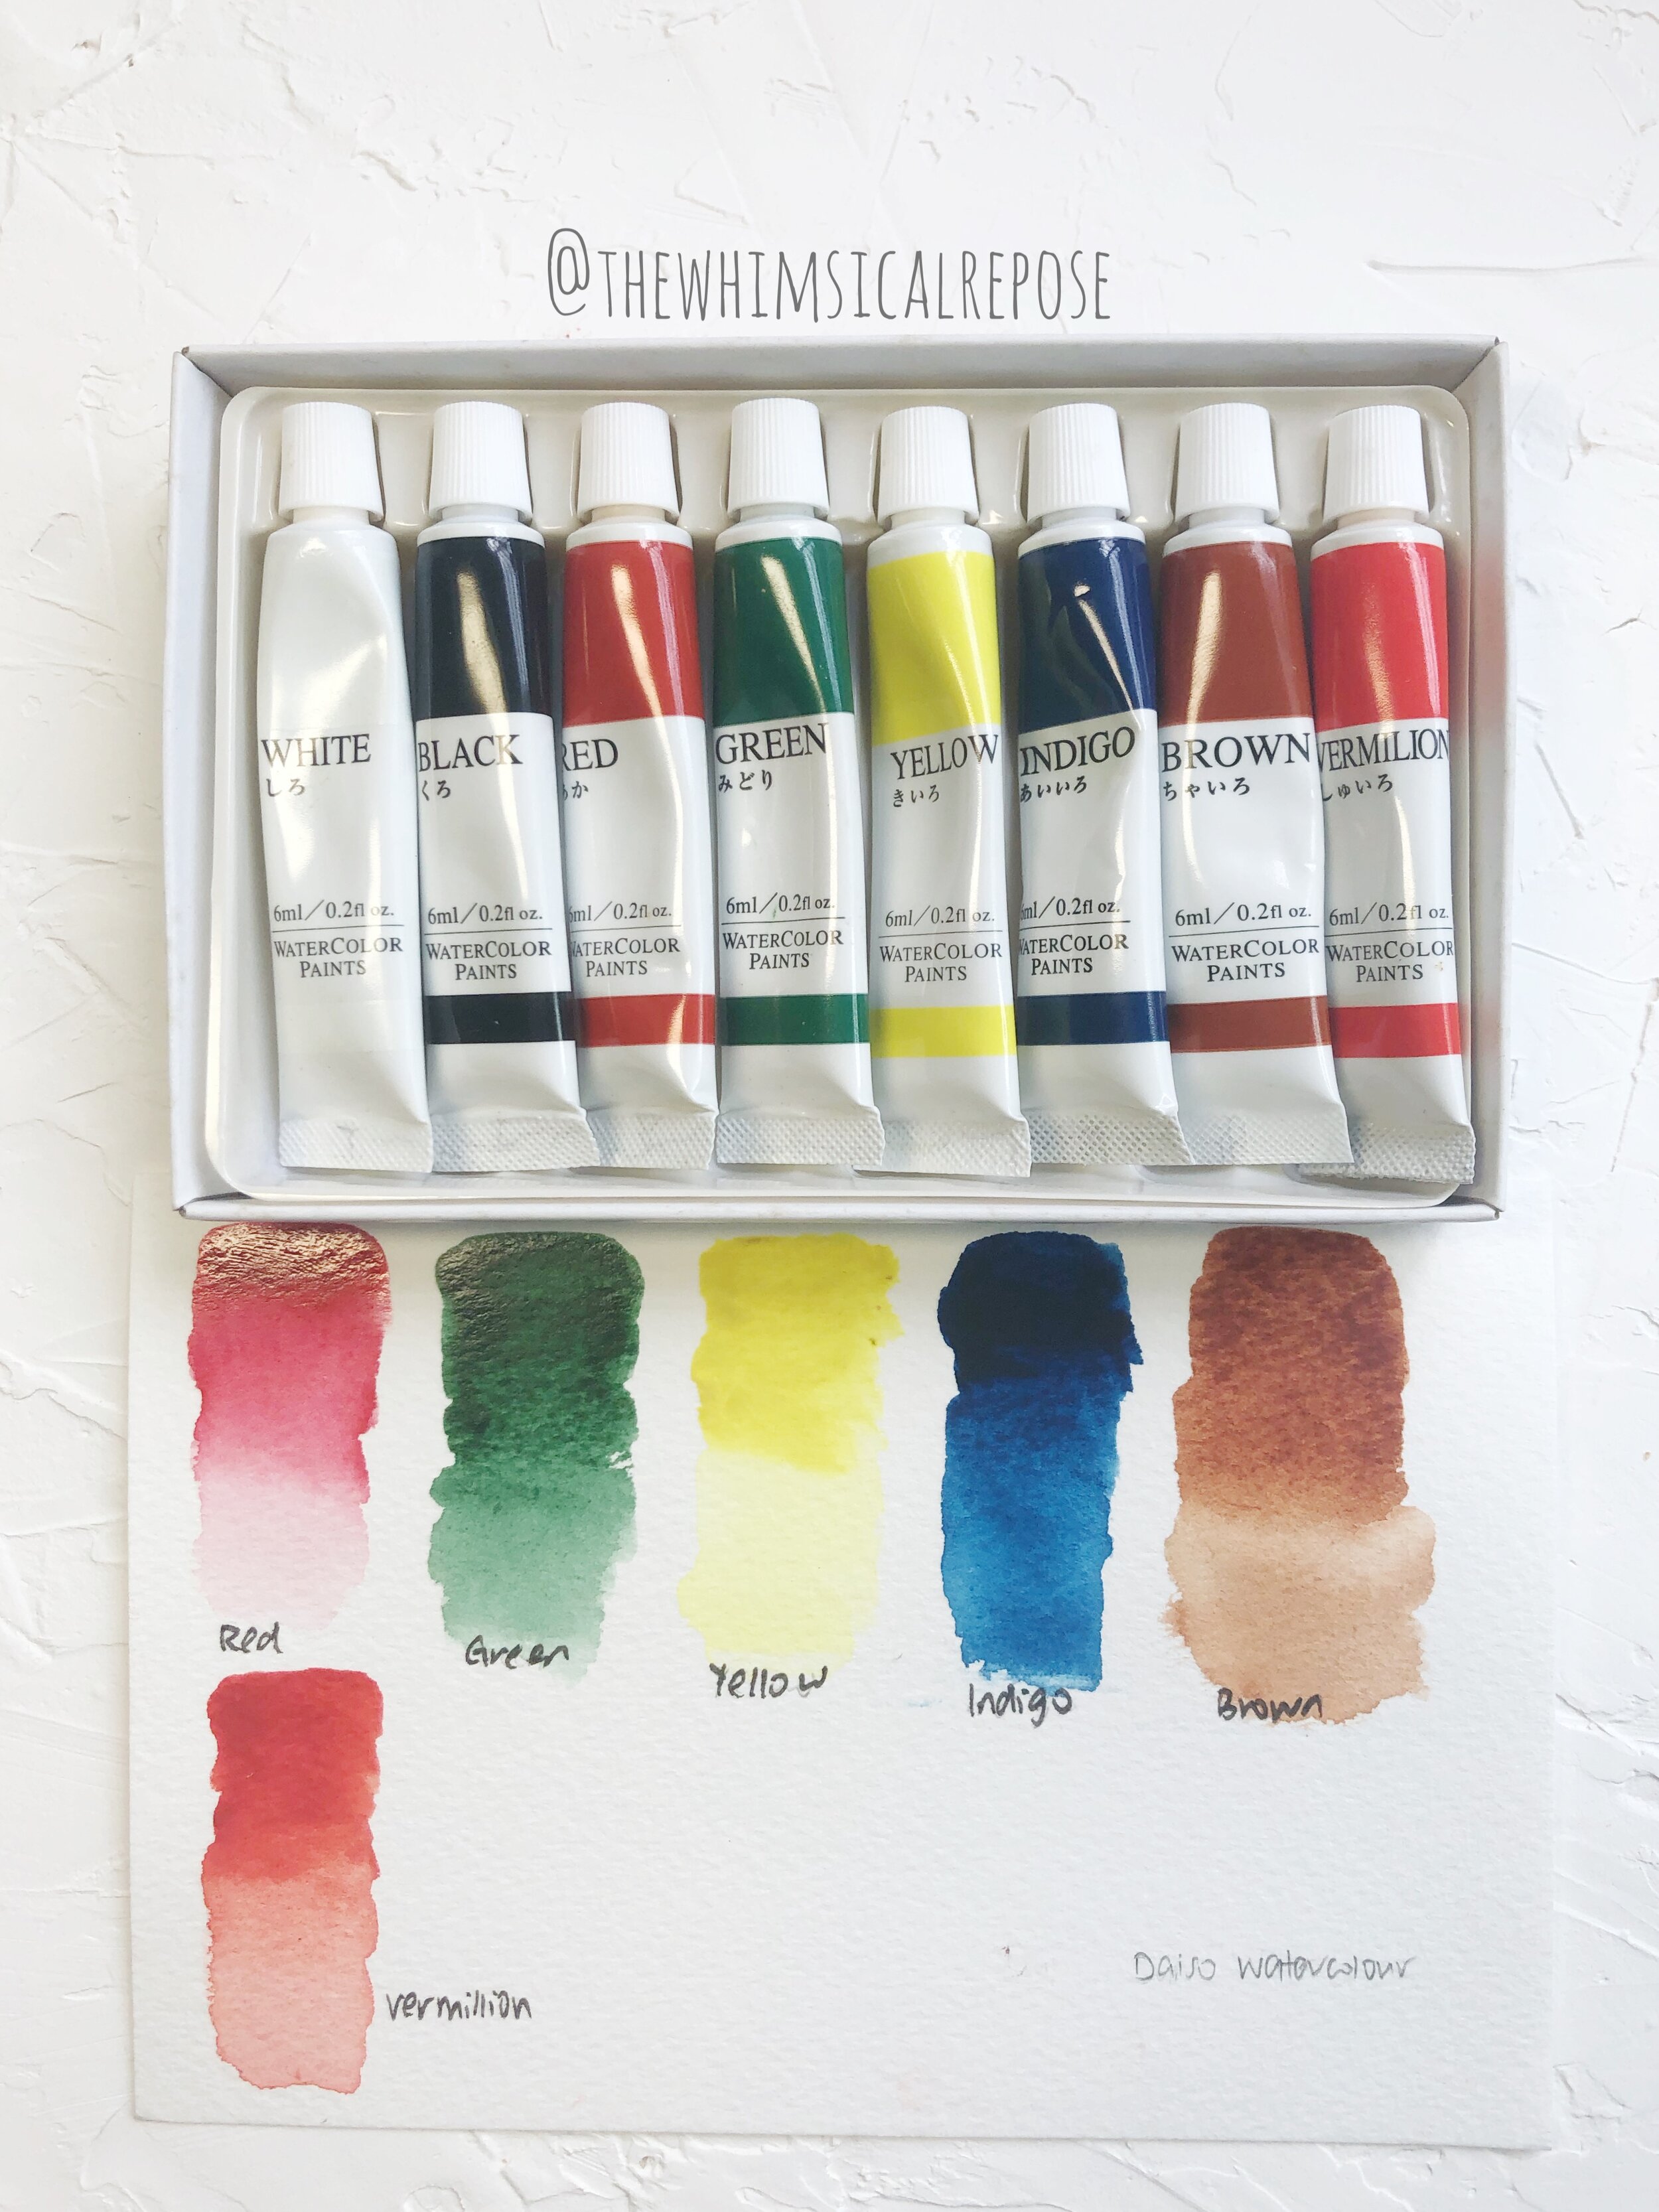
You can see here that I’ve swatched my Daiso watercolours in a value scale method. I start out with the most intense value, and as I move downwards, I wipe off or rinse off excess paint so that the value becomes lighter. This is not the most precise way of creating a value scale chart as I didn’t have boxes drawn out to mark out clearly the level of intensity. But this is a quick and casual method to do a quick test on your watercolours.
Another way to do it is to have all the necessary boxes drawn out, with the most intense colour right at the top, and the lighter values will follow in the subsequent boxes. If you have clearly marked out boxes and you standardize the water usage across the whole chart, the finished piece can be both helpful information for you and also makes for a nice little spot of colour decoration on your table!
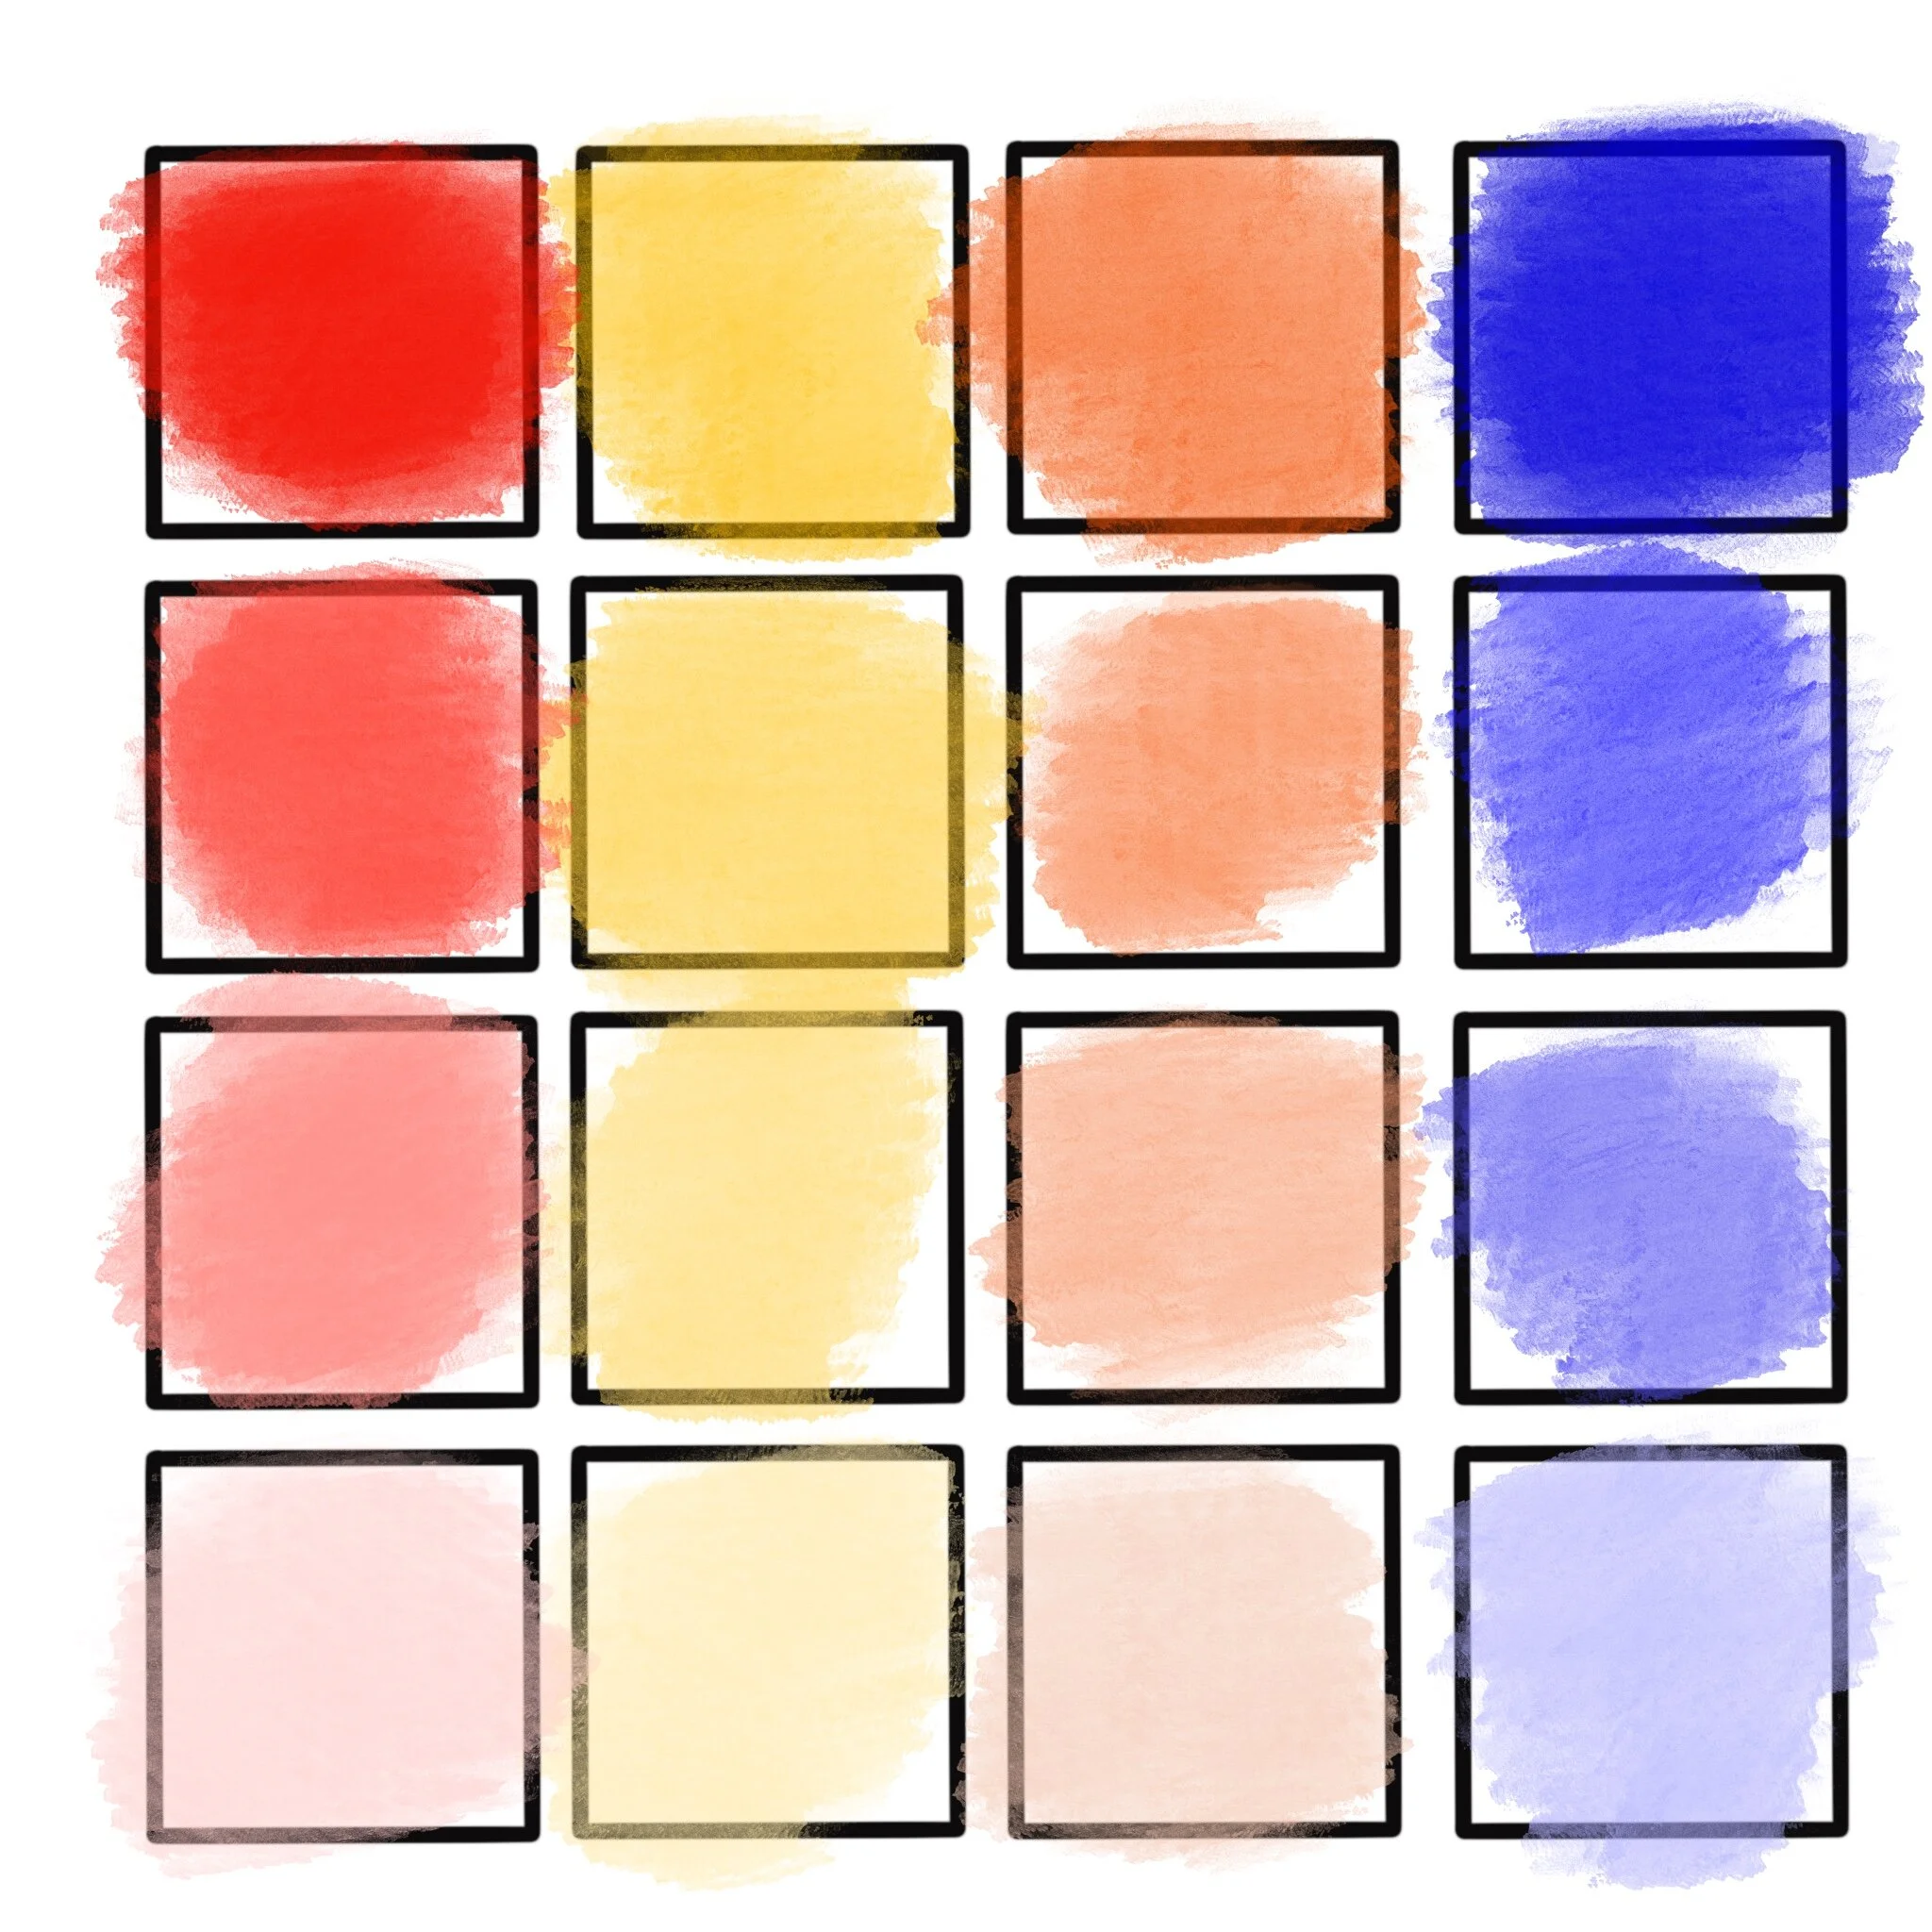
If you’ll like to learn how to make your own value scale chart, I have a free template download for you because I know how bothersome it is to have to measure and draw out all the little boxes! Just tap on the link below to download it.